
TCR-seq / BCR-seq
Immune Repertoire Sequencing
TCR-seq & BCR-seq
T lymphocytes and B lymphocytes serve as pivotal mediators in antigen - specific immune responses. T lymphocytes orchestrate cell - mediated immune reactions and modulate immune functions, whereas B lymphocytes predominantly mediate humoral immunity via antibody synthesis. The antigen recognition process of these lymphocytes is contingent upon their respective surface receptors, namely the T cell receptor (TCR) and the B cell receptor (BCR). TCRs are heterodimers constituted by α and β polypeptide chains, while BCRs are composed of two heavy chains and two light chains. Structurally, both receptors are organized into V (variable), D (diversity), J (joining), and C (constant) regions. Notably, the TCR α chain and BCR light chains lack the D segment. Through V(D)J recombination and rearrangement, TCRs and BCRs attain significant diversity, facilitating the recognition of a wide array of antigens.
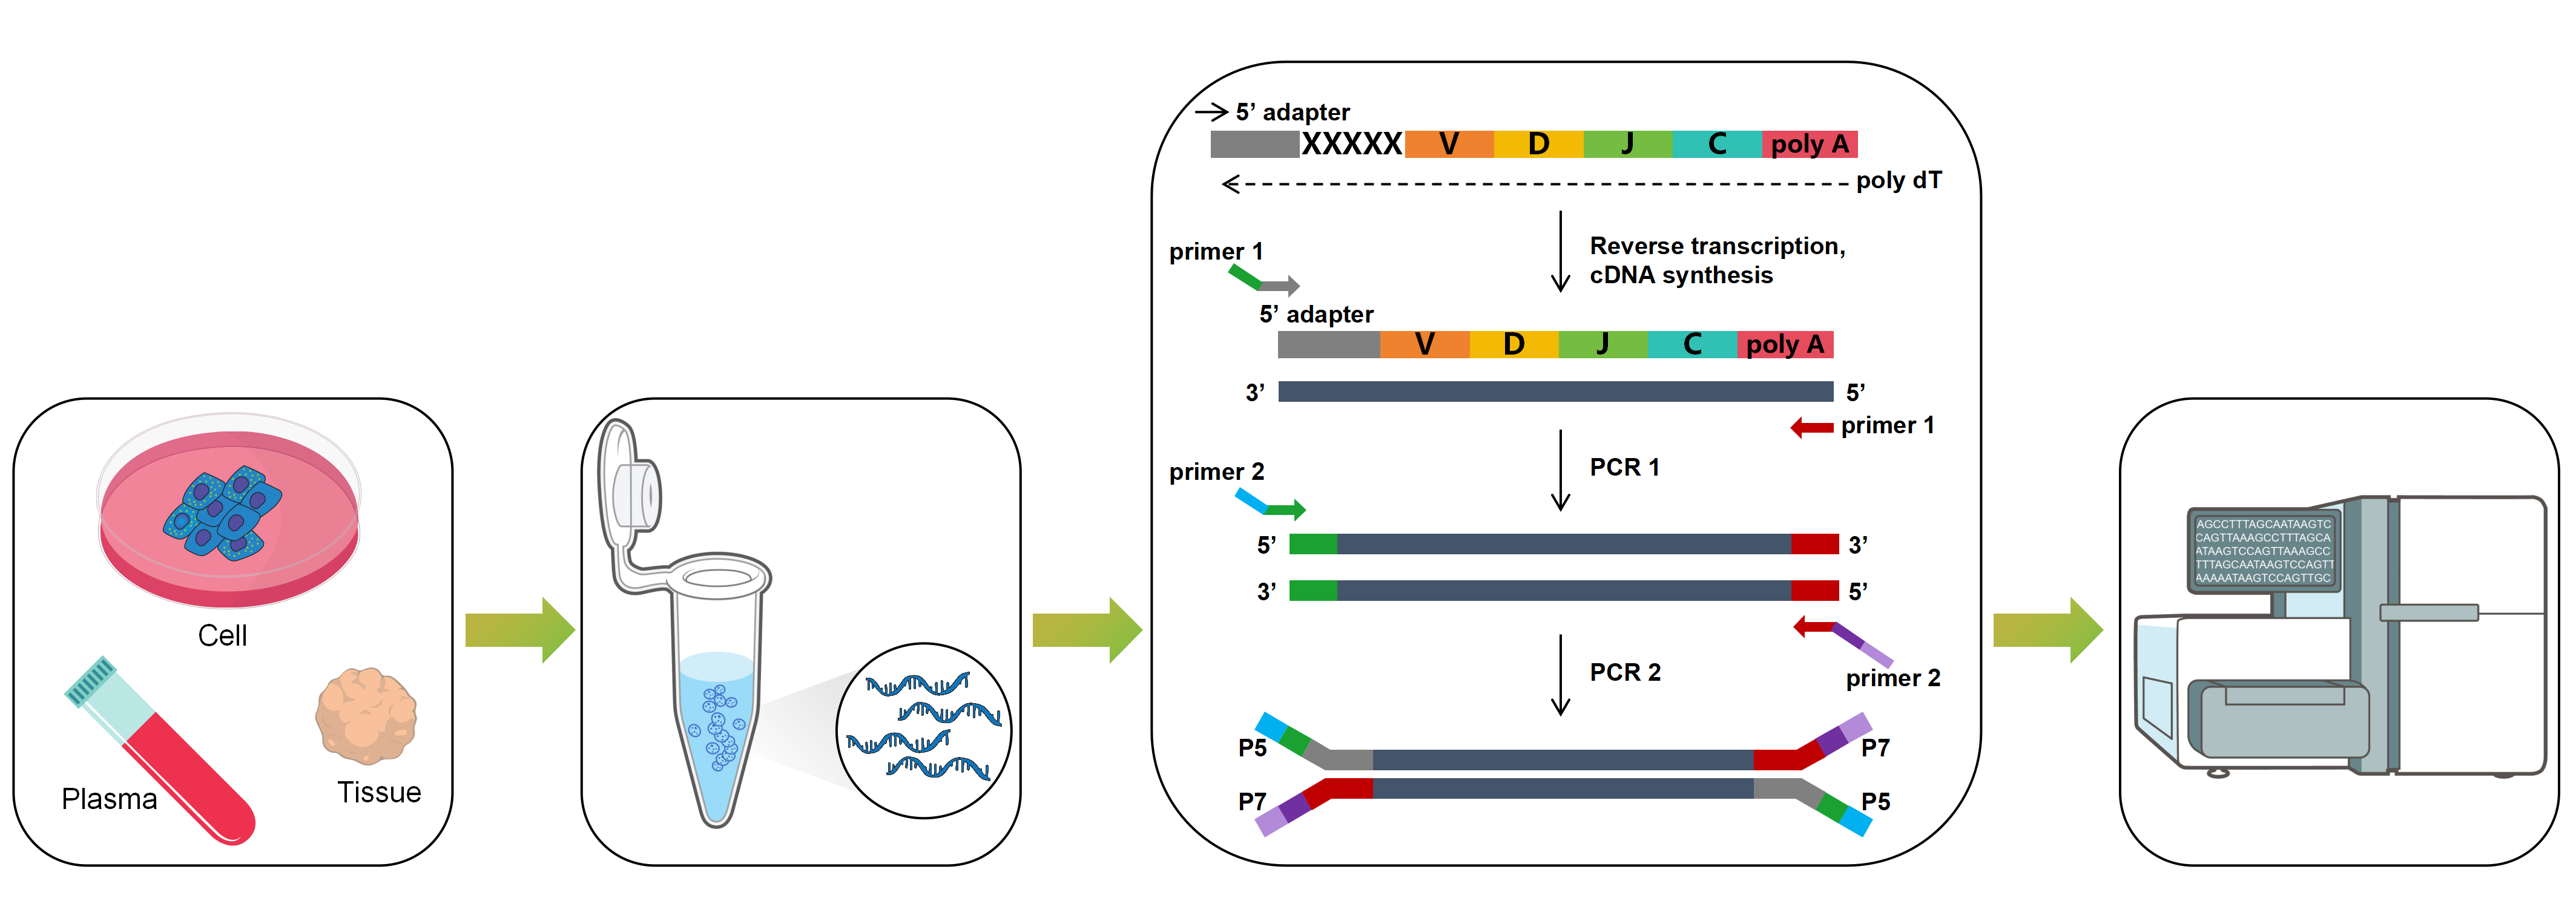
Workflow
Bioinformatic Analysis
Basic Analysis
1. Raw data quality control and filtering
2. Genome alignment
3. Clonotype assembly
4. Basic clonotype analysis metrics
5. CDR3 nucleotide & amino acid length distribution
6. CDR3 clustering analysis
7. V gene usage
8. J gene usage
9. VJ gene usage
10. CDR3 clonotype length distribution
11. CDR3 amino acid motifs
12. V gene-specific CDR3 length distribution
13. Immune polymorphism analysis
Group Analysis
1. Inter-group CDR3 length difference
2. Inter-group V gene usage difference
3. Inter-group J gene usage difference
4. Inter-group VJ gene usage difference
5. Inter-group diversity metrics difference
Advanced Analysis
1. Clonotype diversity
2. Public clonotypes
3. Immune repertoire similarity
Demo
Sample Requirements
cells, tissues, blood, bone marrow, and others
For detailed sample type specifications and quantity requirements, please contact us directly.
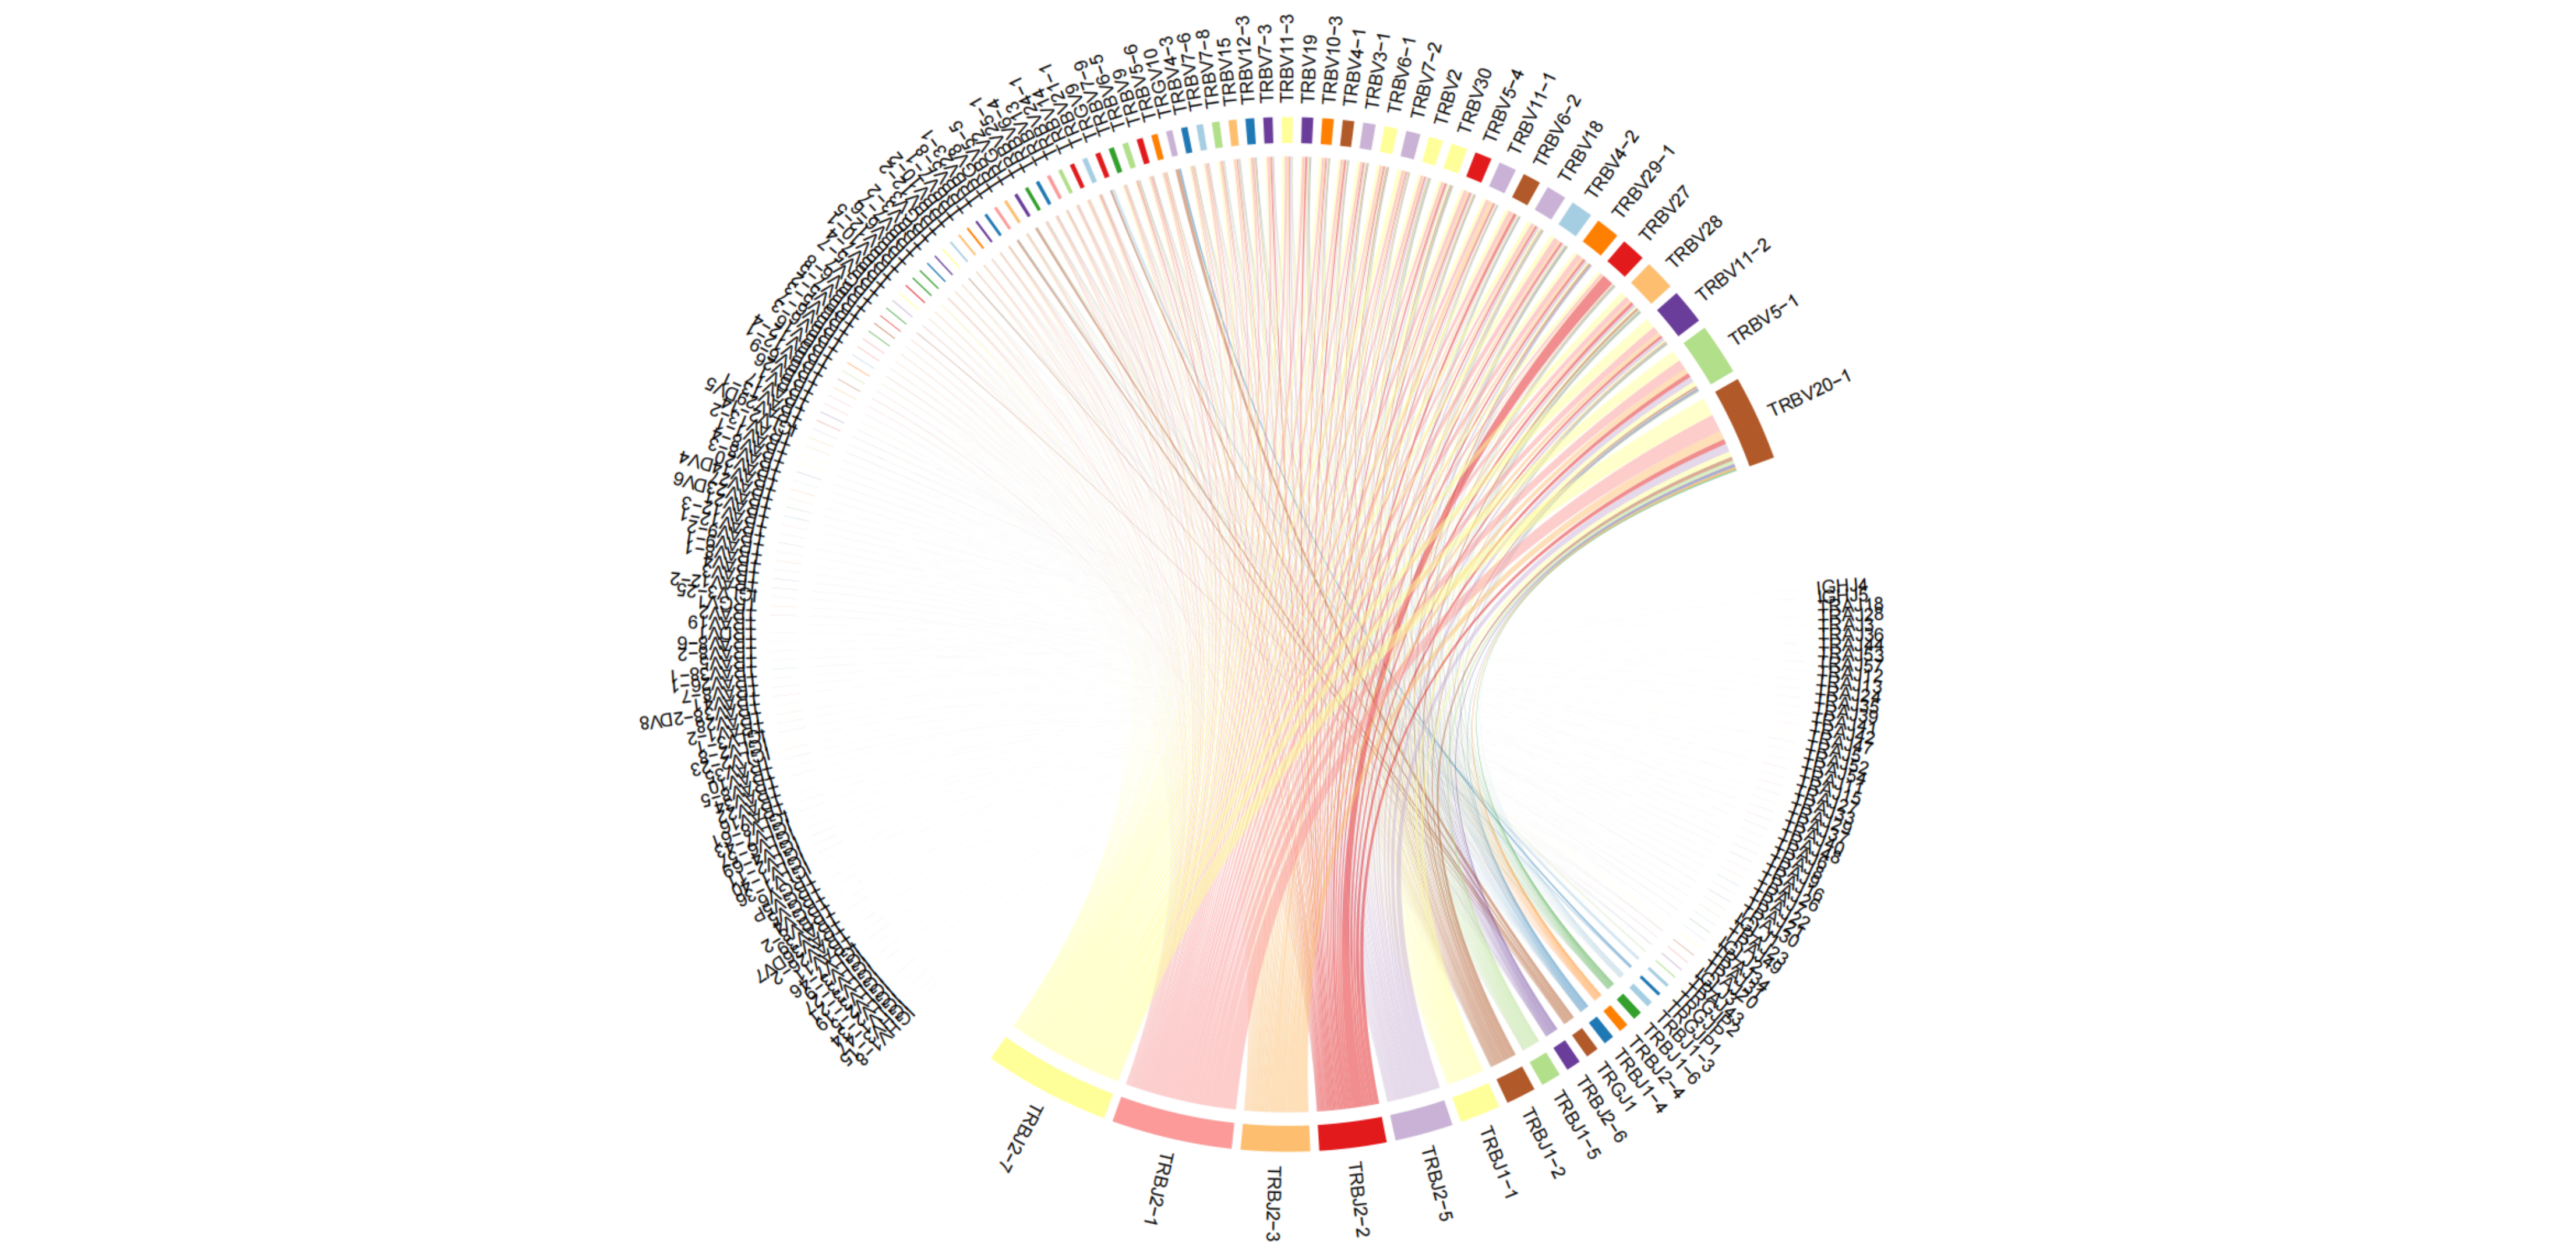
VJ gene usage circos plot
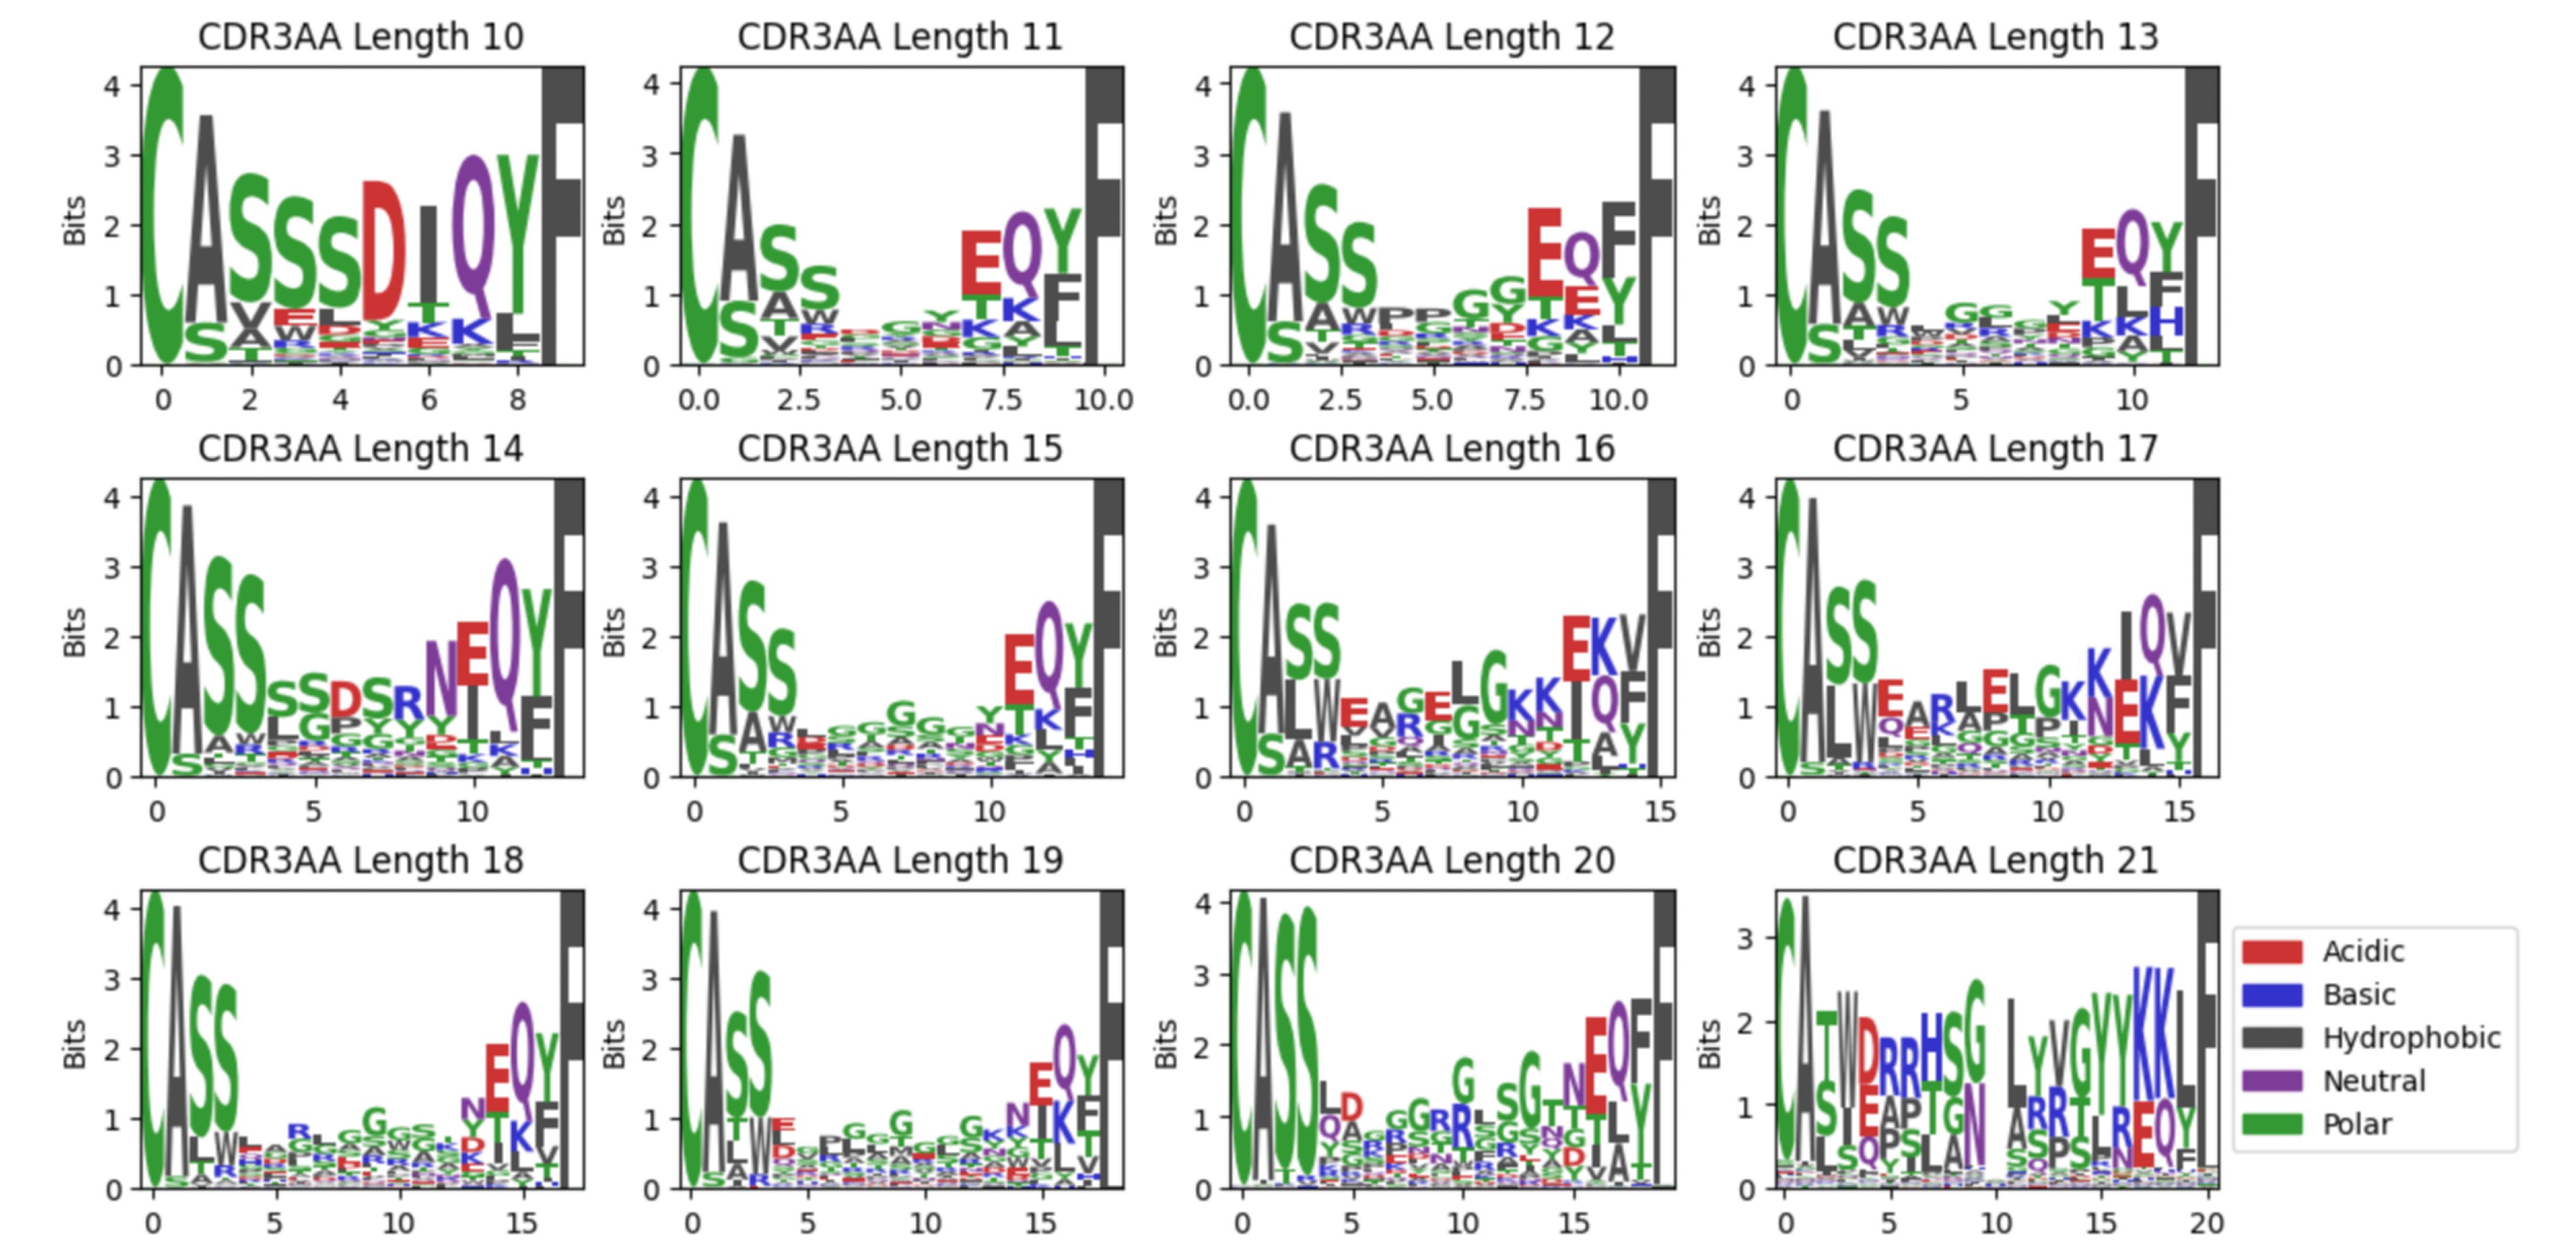
CDR3 amino acid motif frequency distribution
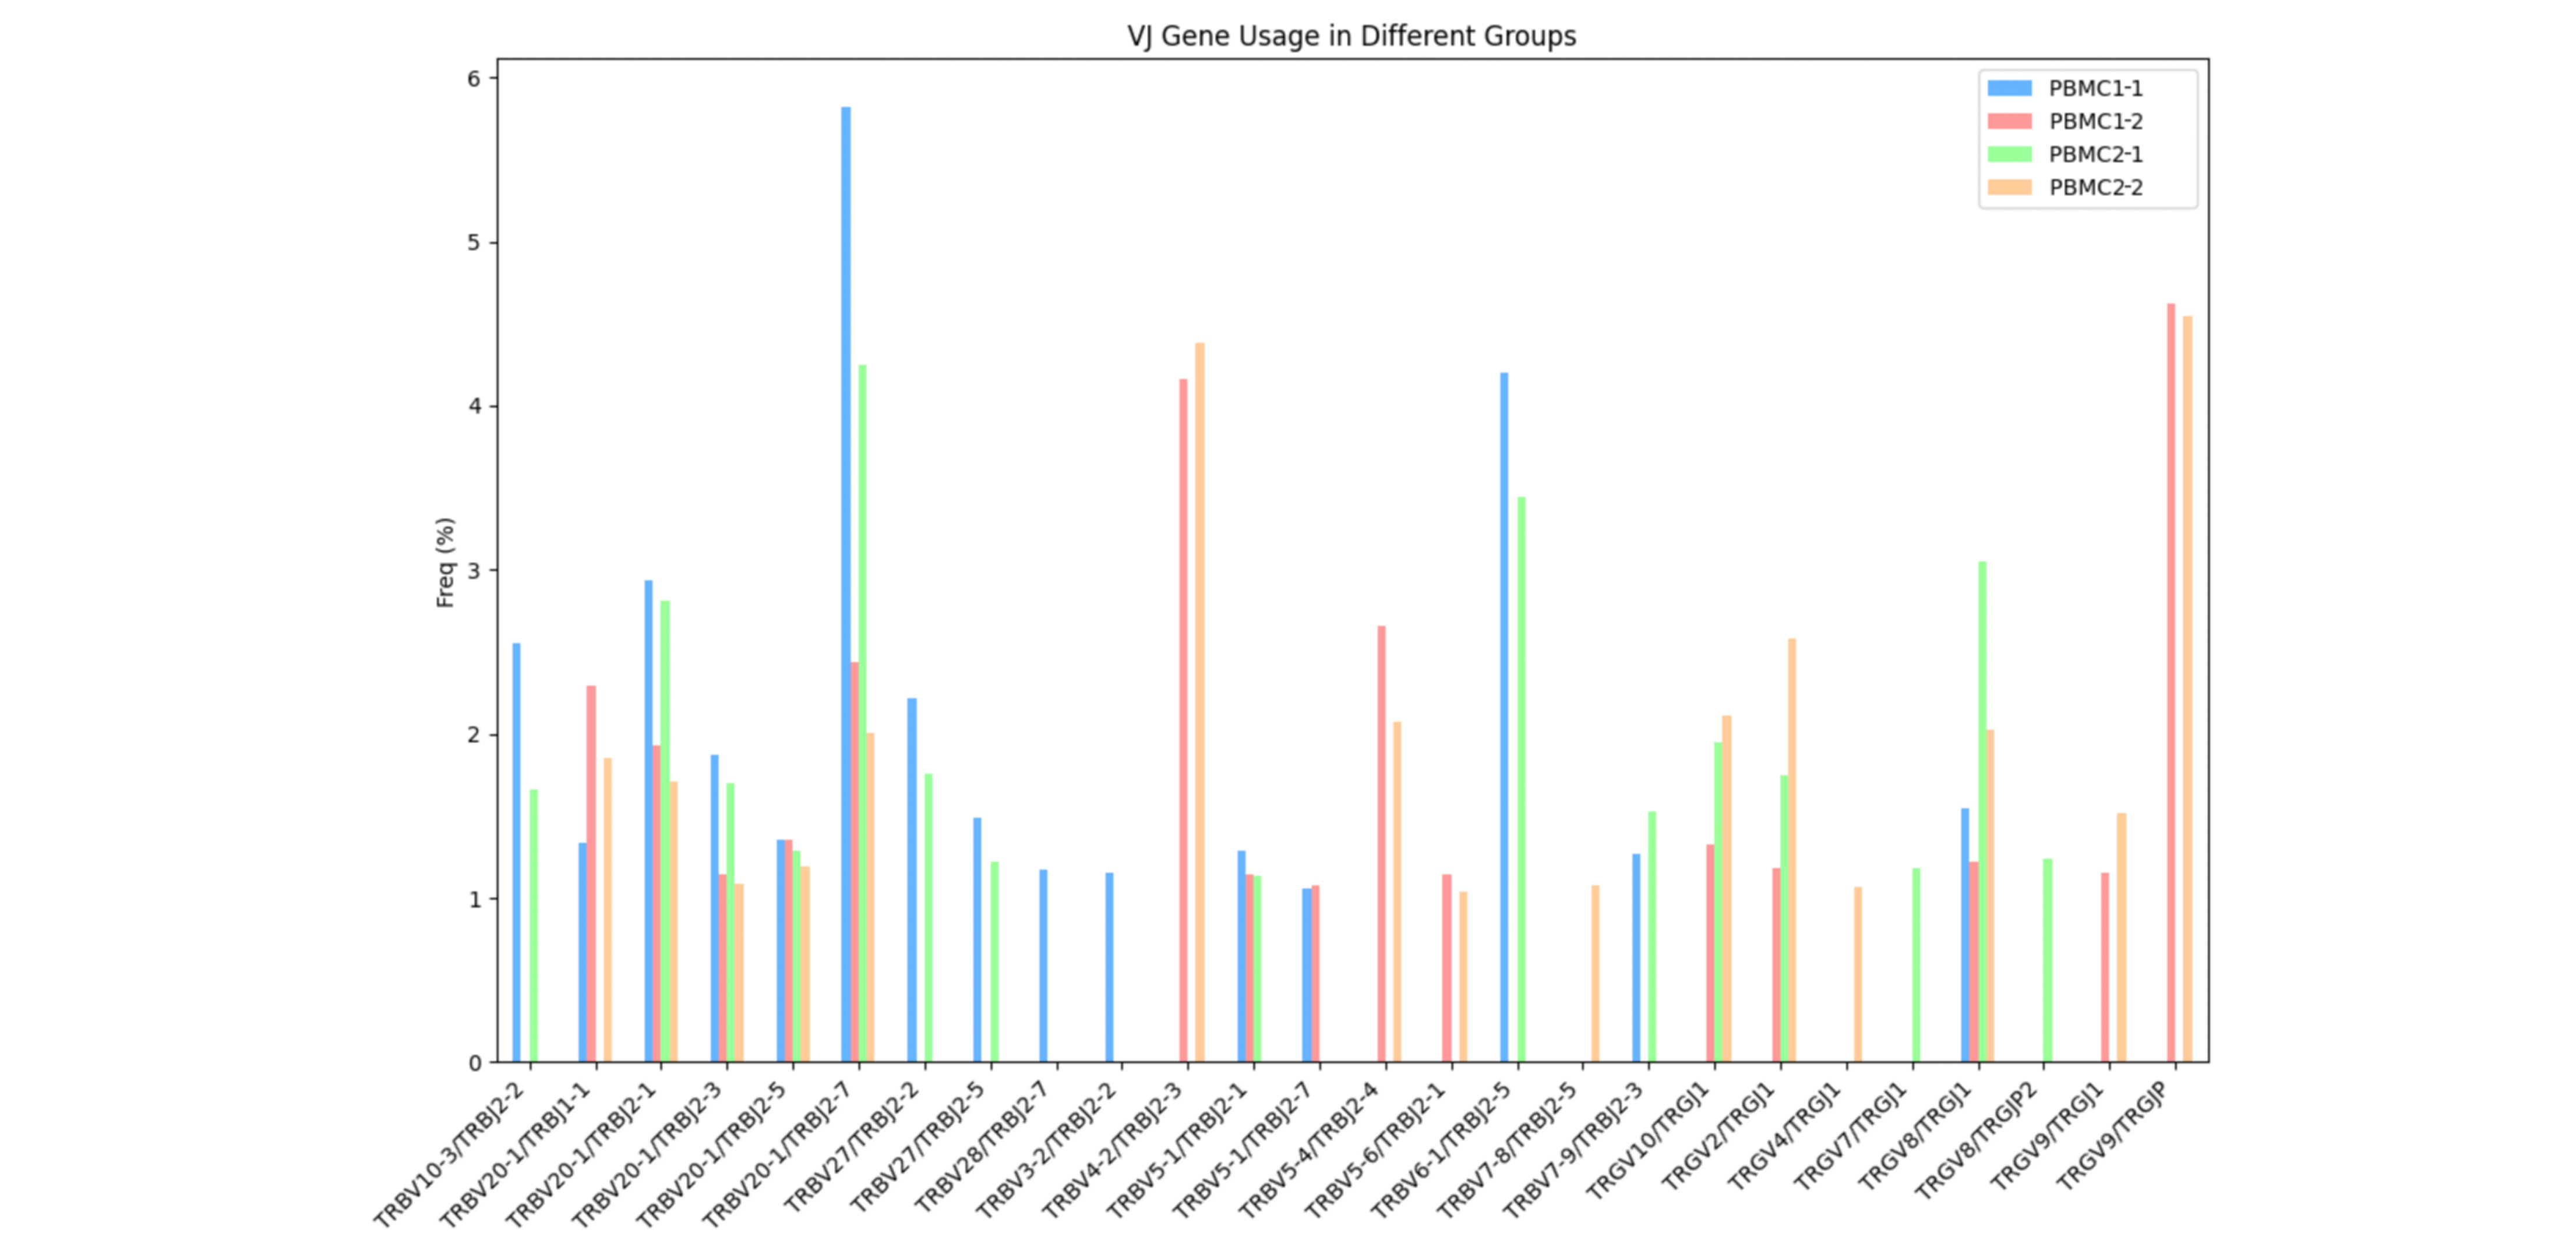
Between-group comparison of VJ gene usage
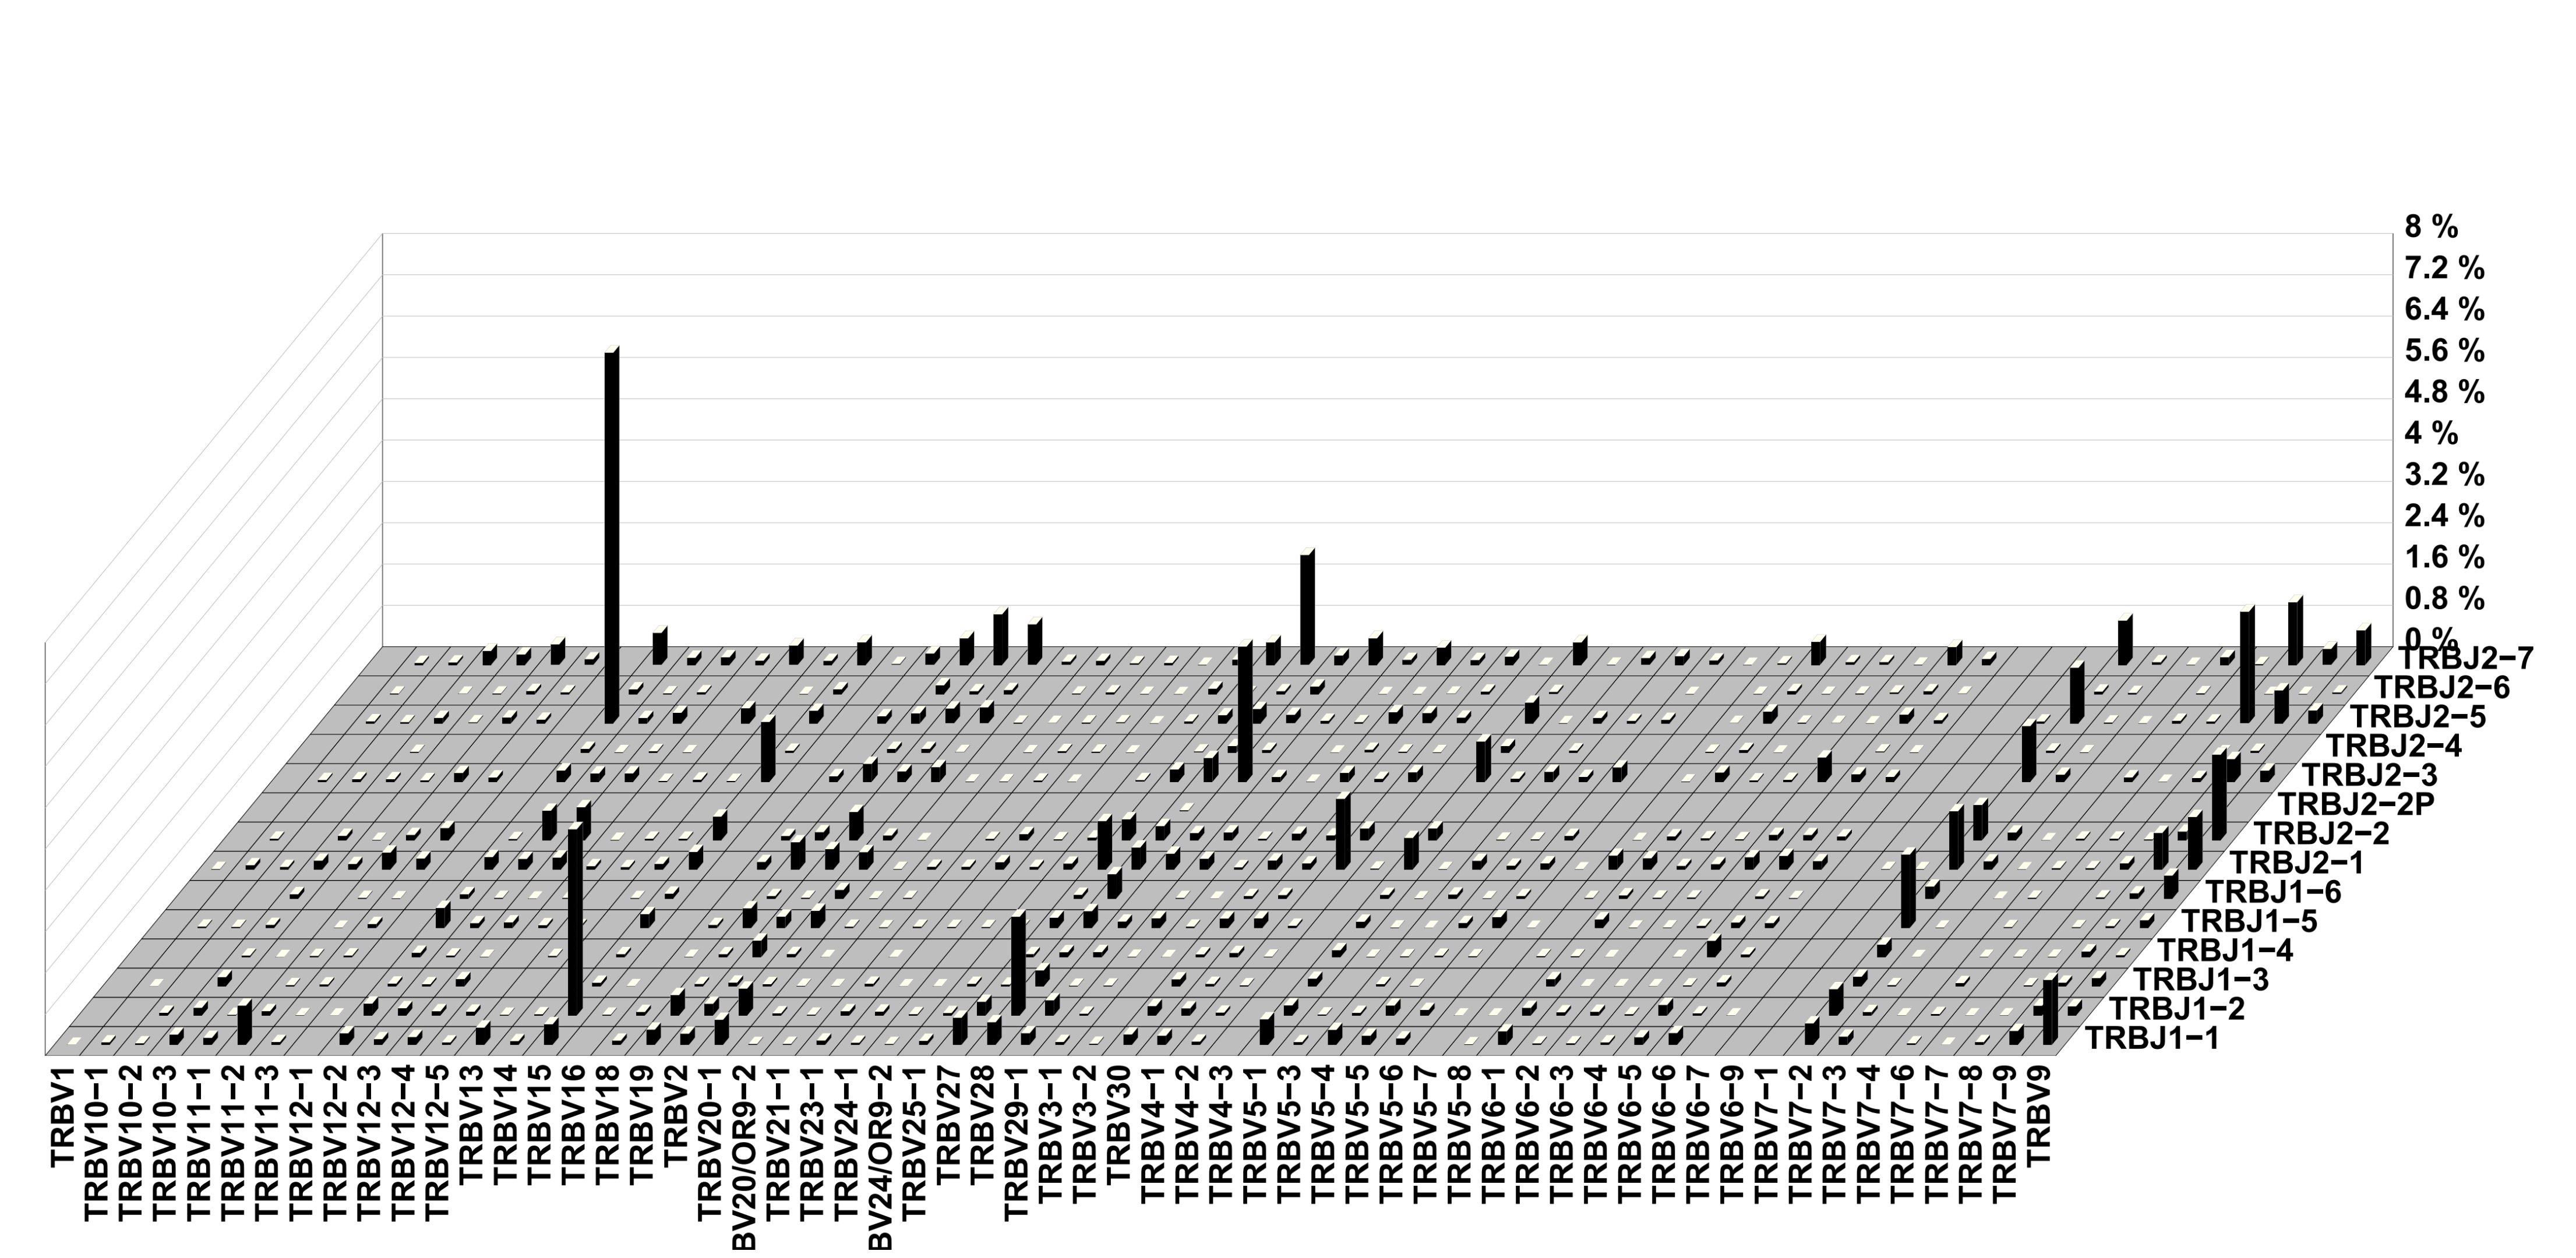
3D bar chart of immune polymorphism analysis
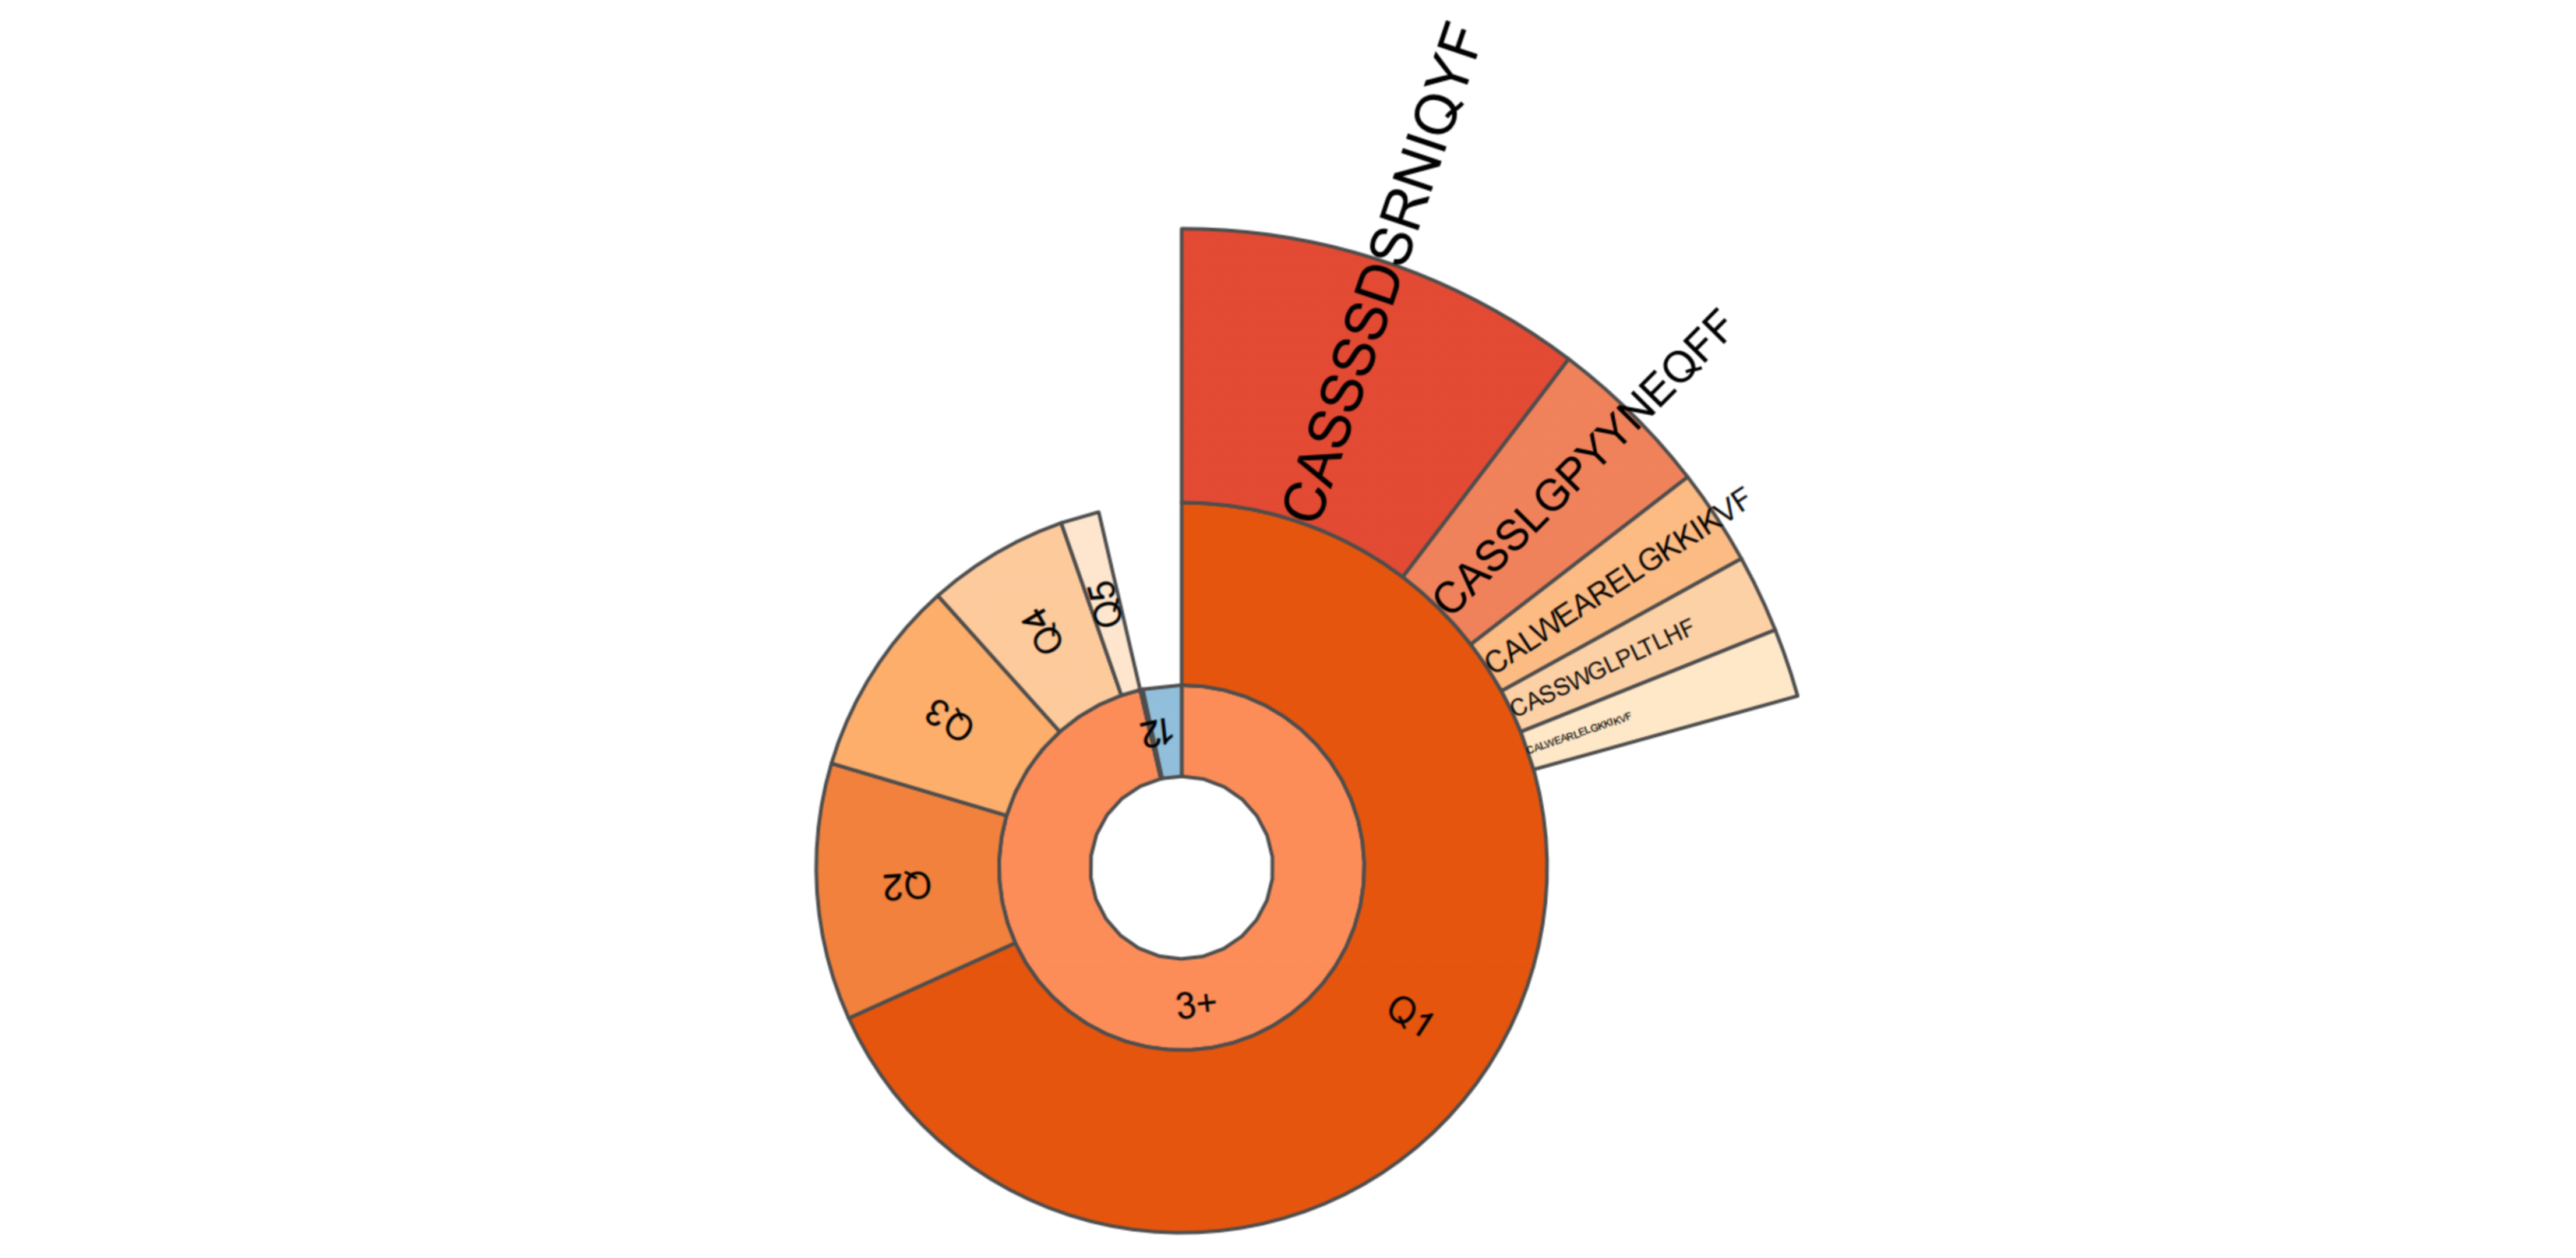
Three-layer donut chart of clonotype distribution
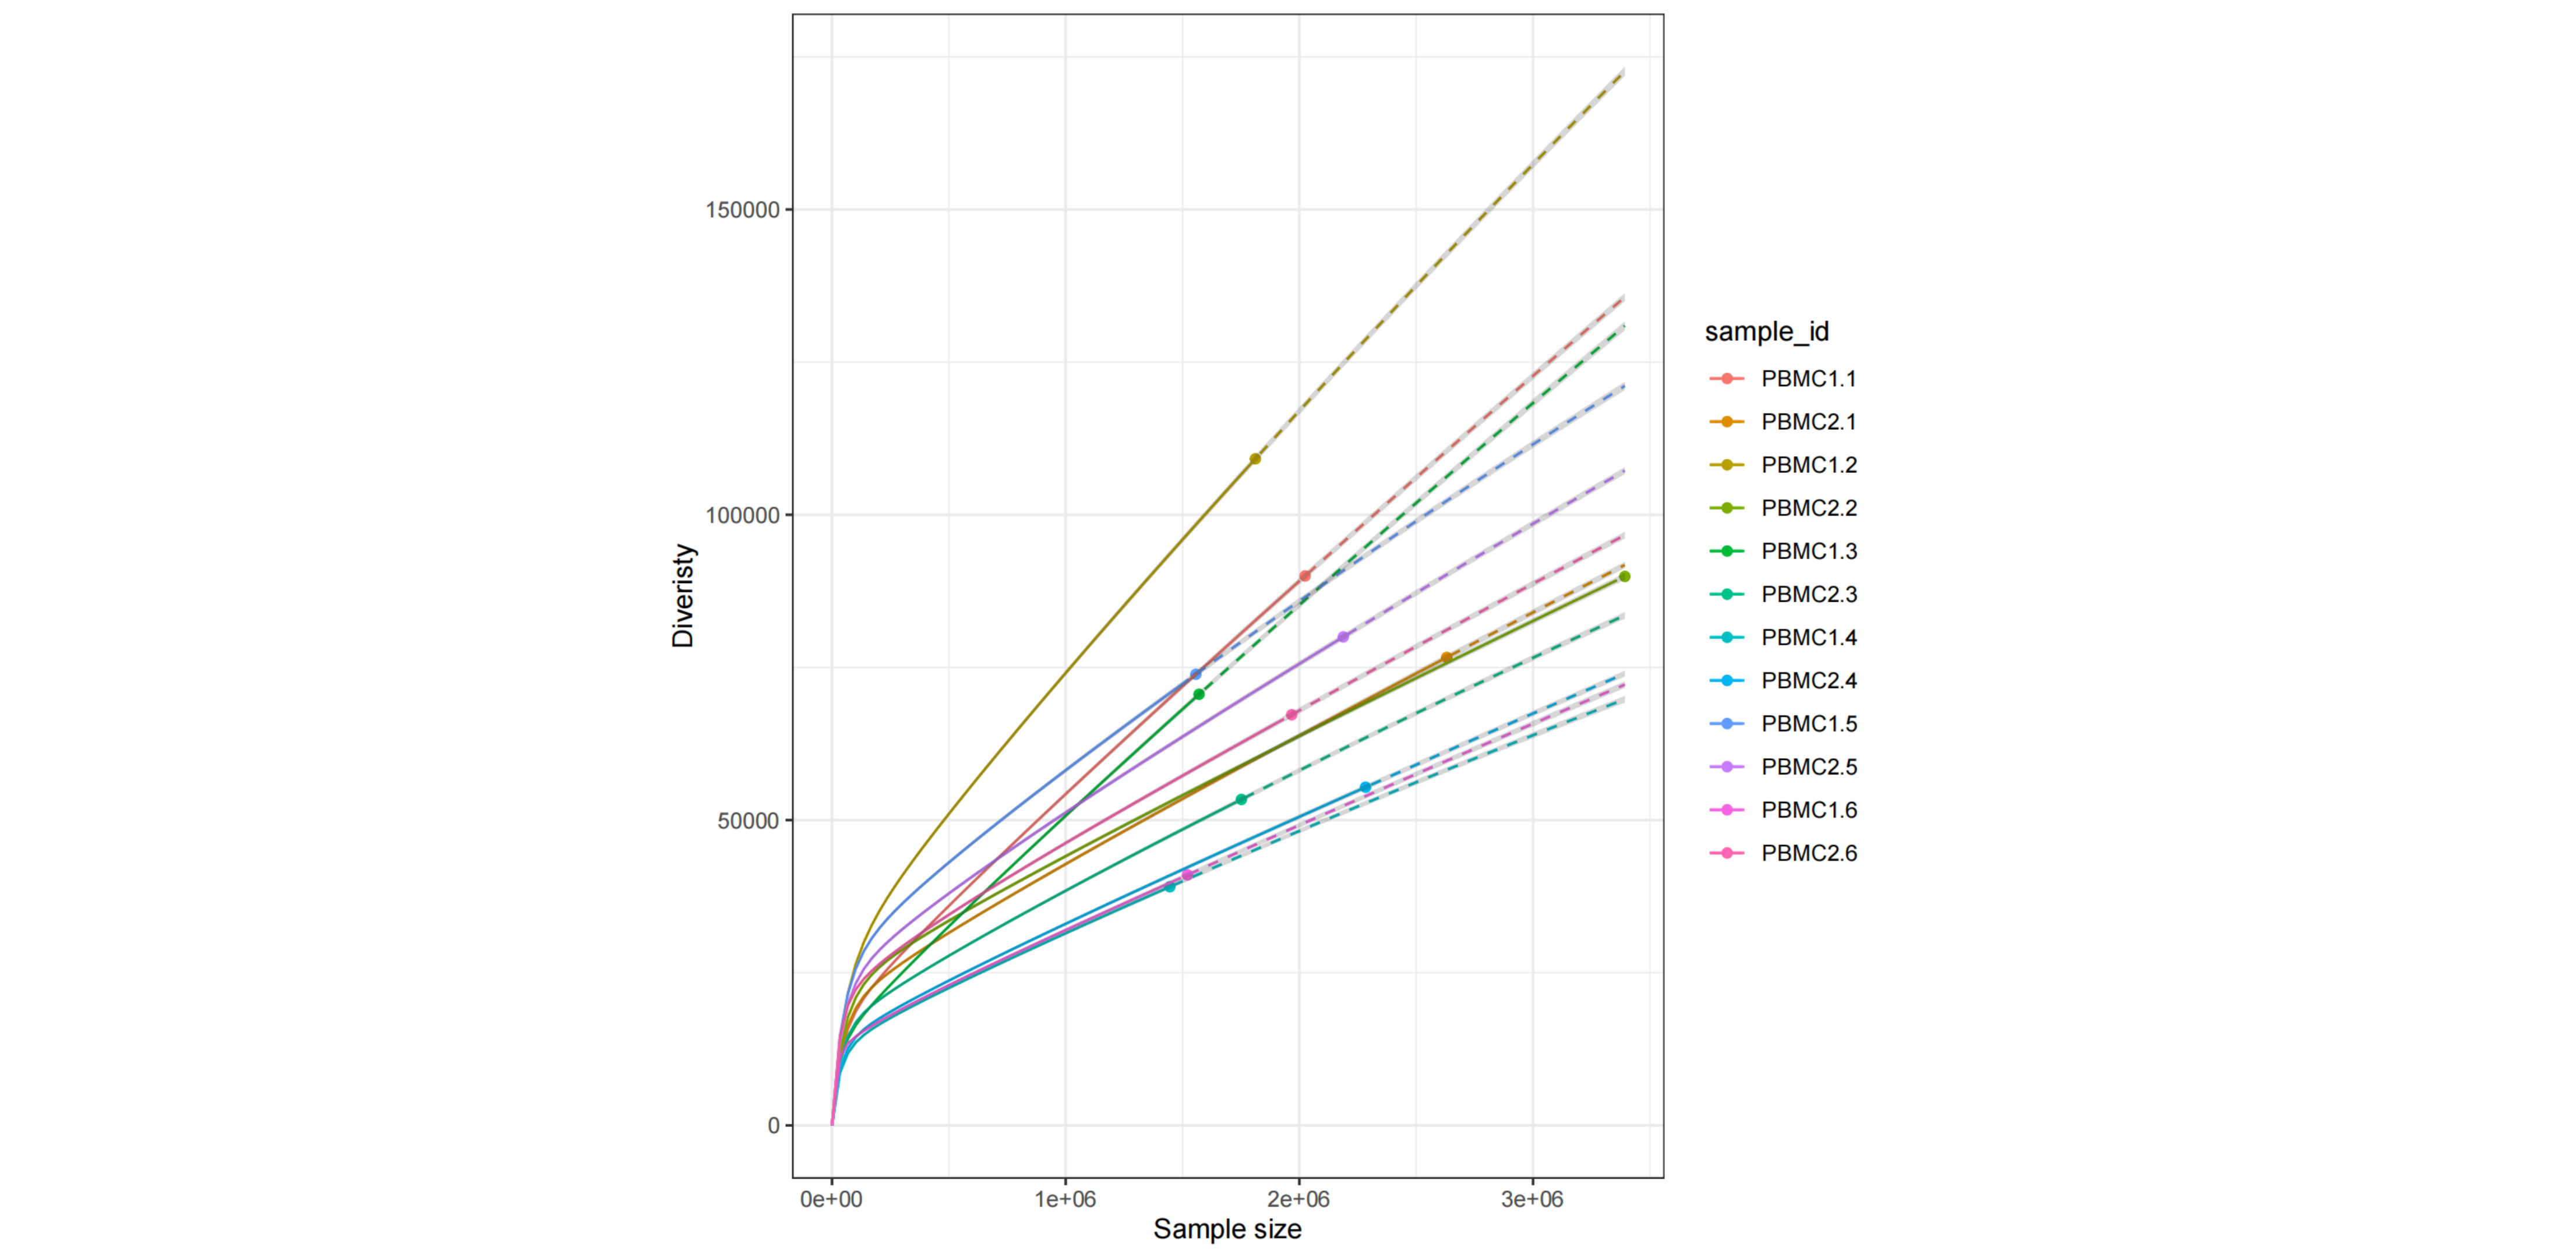
Rarefaction curve of repertoire diversity versus sample size
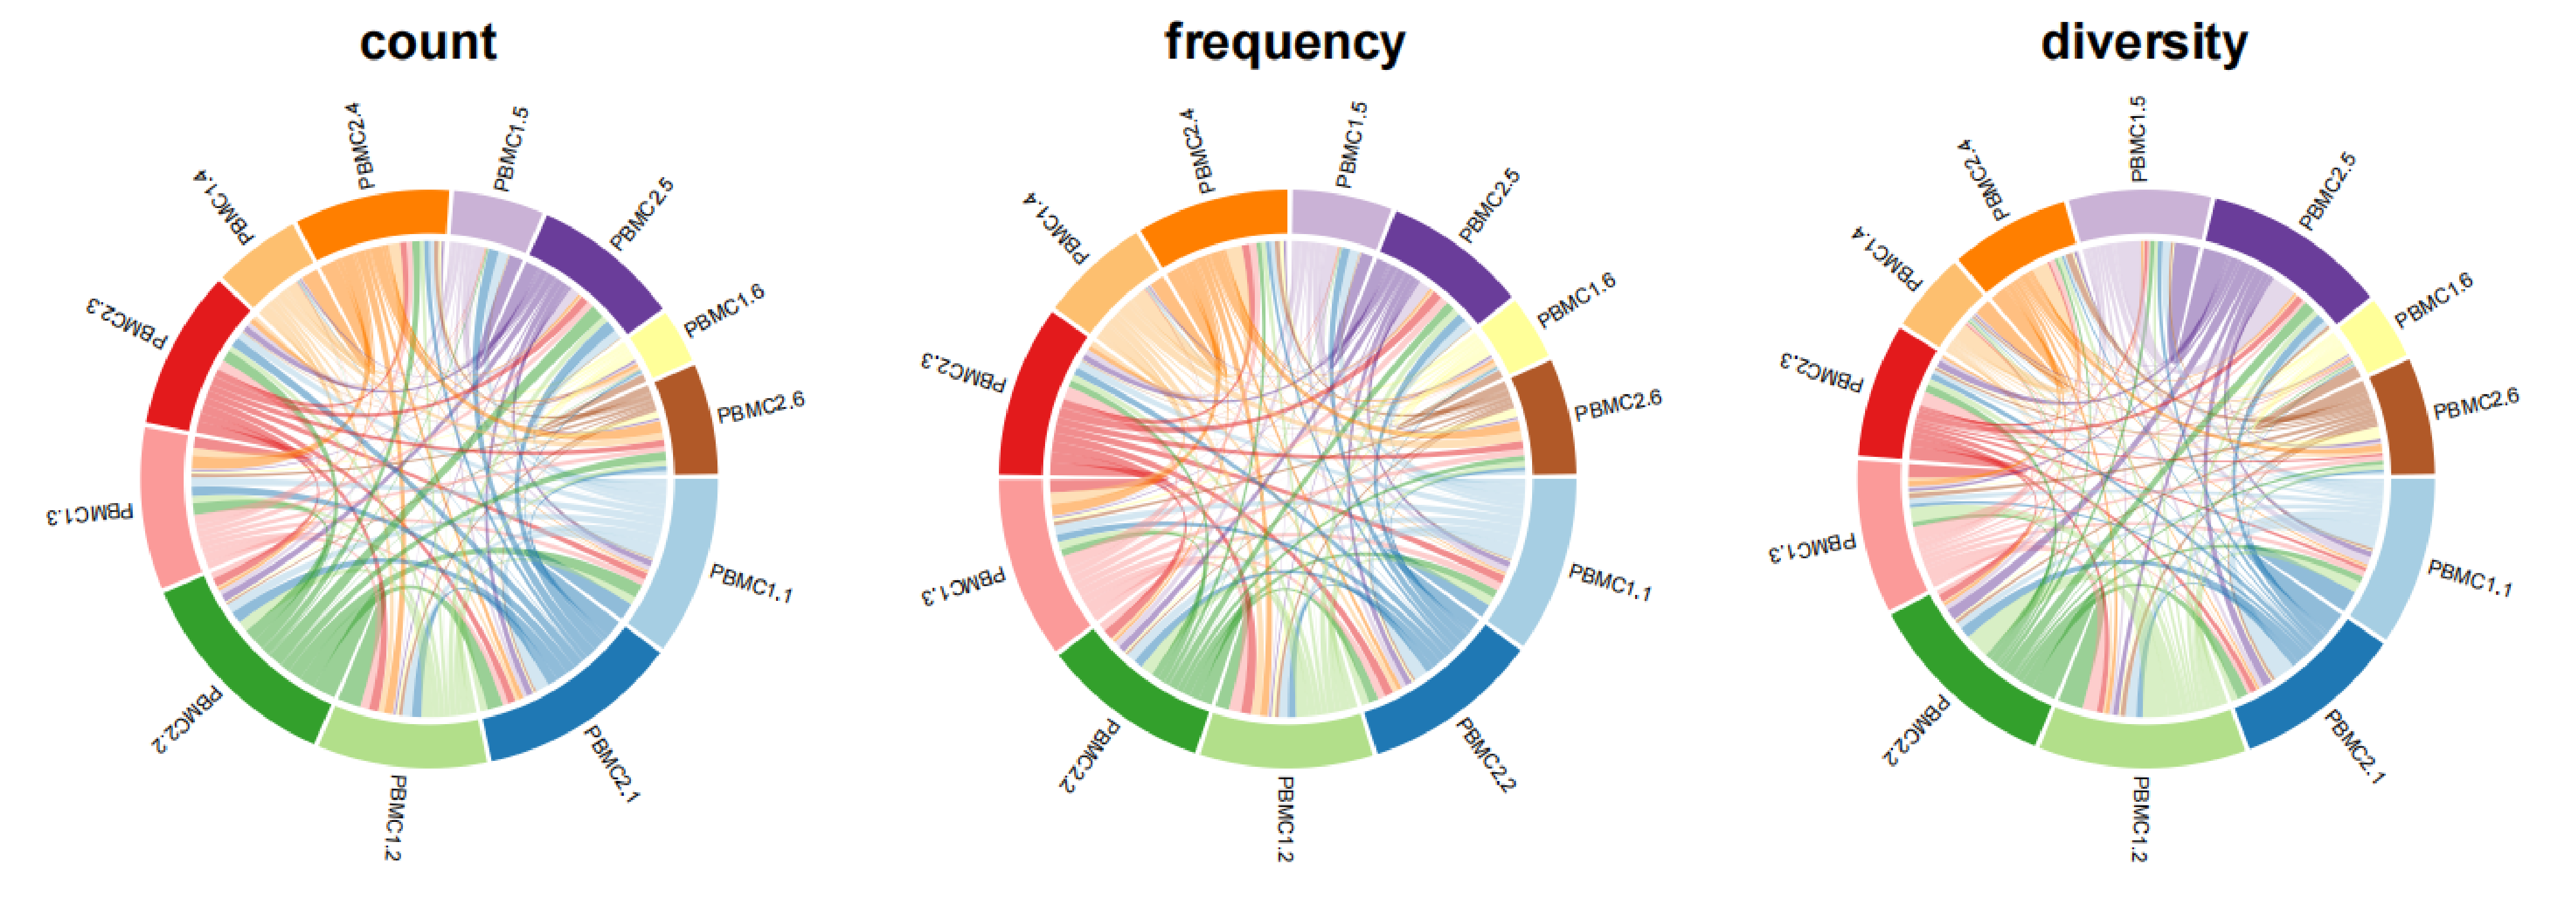
Overlap circos plot